 Run click the button to execute the code.
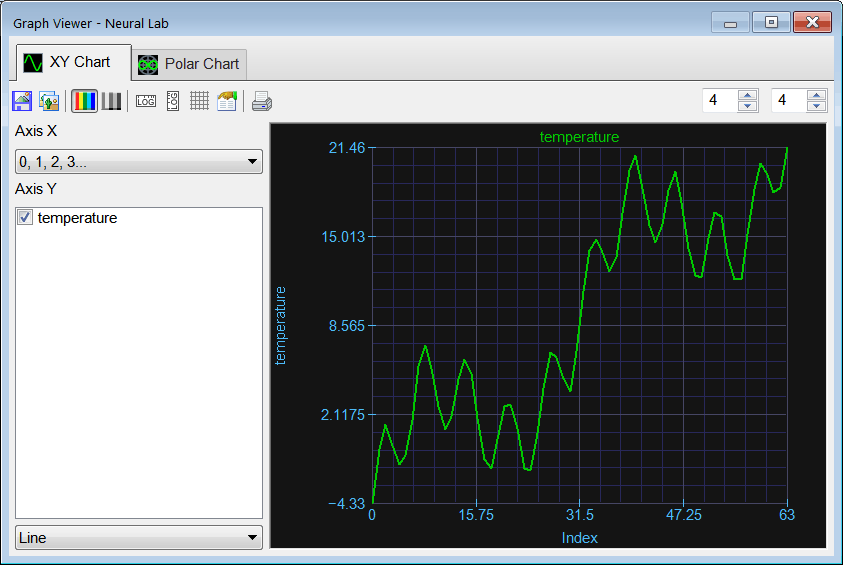
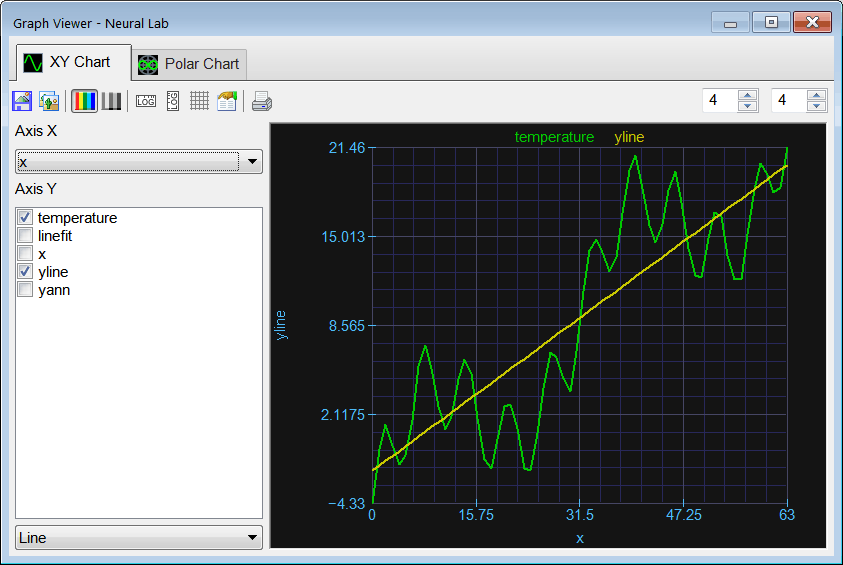
  Graph click the button to plot the data as shown. As it can be seen from the plot the series exhibits a clear increasing trend (yellow line).
 Trending |
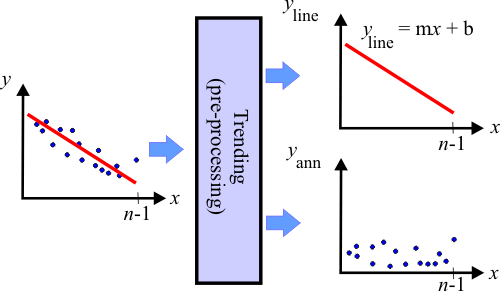
| The process of eliminating the natural tendency in a series is called trending. Trending is one pre-processing method that is typically used in prediction. By eliminating the tendency in the data, an ANN is capable to discover and learn hidden patterns that are not so obvious. One simple way to perform the trending is by computing a linear approximation using regression, and then removing this tendency from the original data as shown in the figure. Thus, the original series y may be divided in two new series: y(line) and y(ann). |
| Tip |
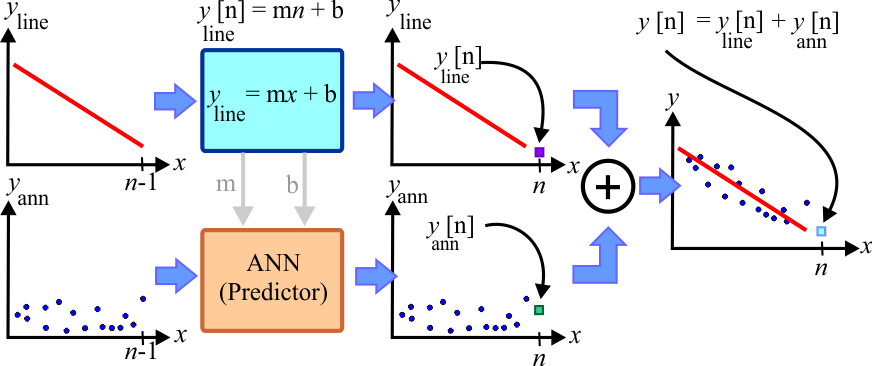
| Many data series than exhibit some sort of trend can be divided into two series. The prediction of a value in this kind of series can be divided into the prediction of two values: yn(line) and yn(ann). Specifically, it is possible to predict a value for each of the new series, and the total prediction value can be obtained by adding each of the predictions as shown in the figure below. As one of the series fits approximately a line, it is very simple to compute the prediction for this series using the equation of the line y = mx + b. To predict the value on the other series an ANN can be used as before. |
| Tip |
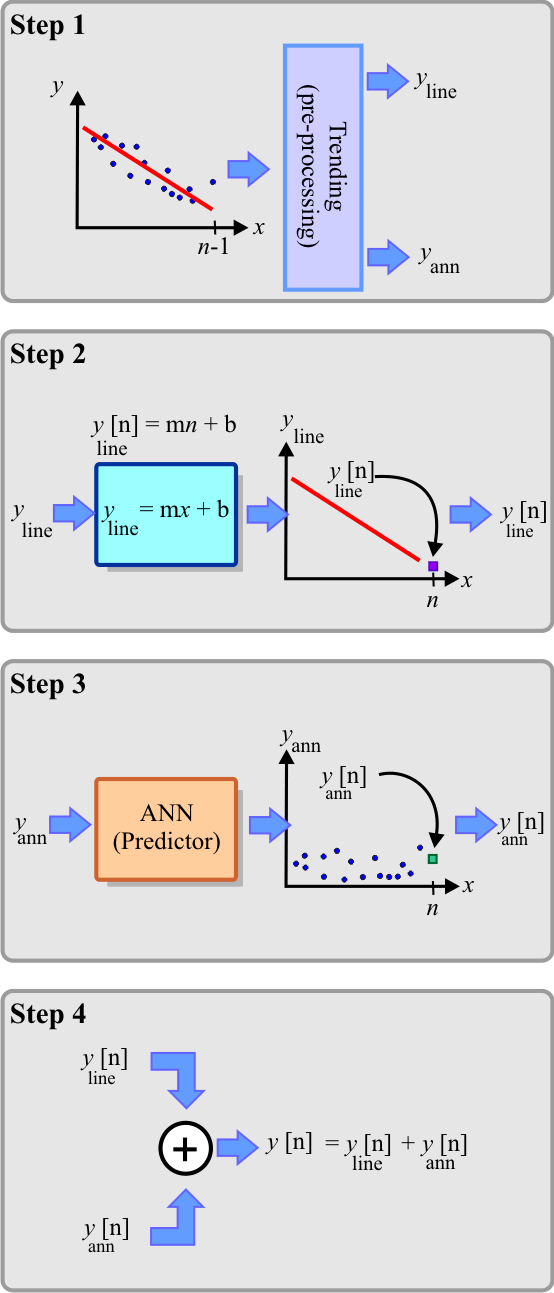
A prediction problem by removing the trend of the series has four steps as described in the figure below.
|
| Problem 1 |
| Create a New Project called PredTrend to predict the temperature in a small city in Europe using trending. You can check the option of Prediction Analysis to save typing some code. Copy the original temperature.csv file to this project and plot the temperature and indicate if the time series exhibits some trend that can be removed. Copy the Temperature.lab file to this project. |
| PredTrend\Temperature.lab |
| Vector temperature; temperature.Load(); |
| Problem 2 |
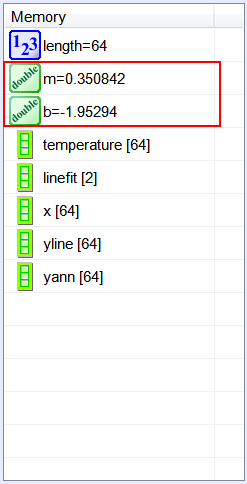
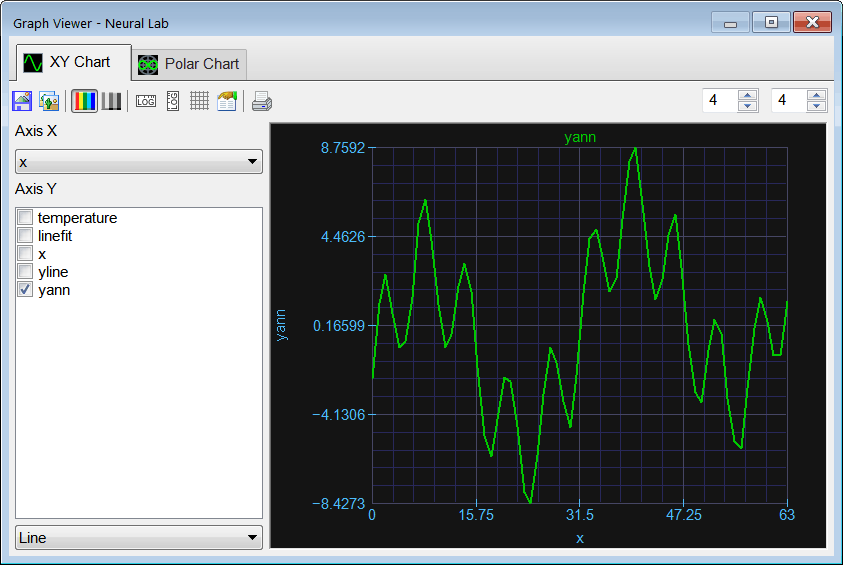
| Perform STEP 1. (a) Compute the value of m and b of the line y = mx + b that best fits the data. (b) Remove the trend from the original series to create yann. |
| Solution 2 |
Add the RemoveTrend.lab file to compute the line that best represent the trending of data and removes this trend. After editing the file,  Run click the button to execute the code. Run click the button to execute the code.  Graph click the button to plot the data as shown. As it can be seen from the plot the series exhibits a clear increasing trend (yellow line). Graph click the button to plot the data as shown. As it can be seen from the plot the series exhibits a clear increasing trend (yellow line). |
| PredTrend\RemoveTrend.lab |
| Vector temperature; temperature.Load(); int length = temperature.GetSize(); Vector linefit = temperature.LineFit(); double m = linefit[0]; double b = linefit[1]; linefit.Save(); //_____________________ Create a line to display Vector x; x.CreateSeries(0, length-1, length); Vector yline = m*x+b;//_____________________ Remove the trend Vector yann = temperature - yline; yann.Save(); |
| Problem 3 |
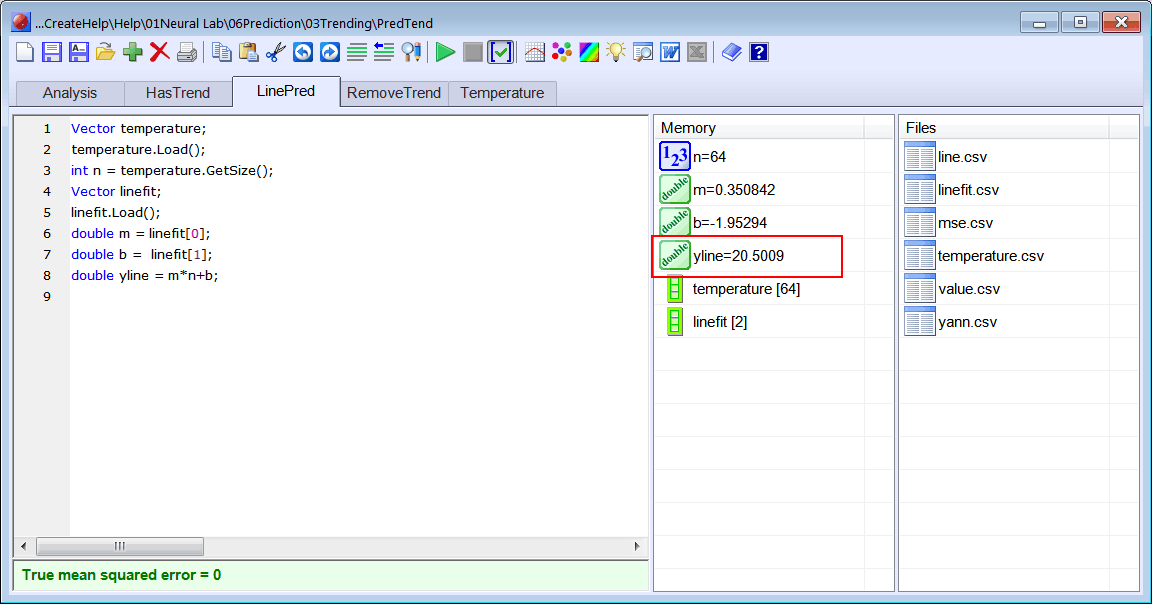
| Perform STEP 2. Estimate the line prediction using the equation of the line. That is estimate yline[64]. |
| Solution 3 |
Add the LinePred.lab file and write the code shown below.  Run click the button to execute the code. Run click the button to execute the code. |
| PredTrend\LinePred.lab |
| Vector temperature; temperature.Load(); int n = temperature.GetSize(); Vector linefit; linefit.Load(); double m = linefit[0]; double b = linefit[1]; double yline = m*n+b; |
| Problem 4 |
| Perform STEP 3. Estimate yann[64] using prediction analysis. |
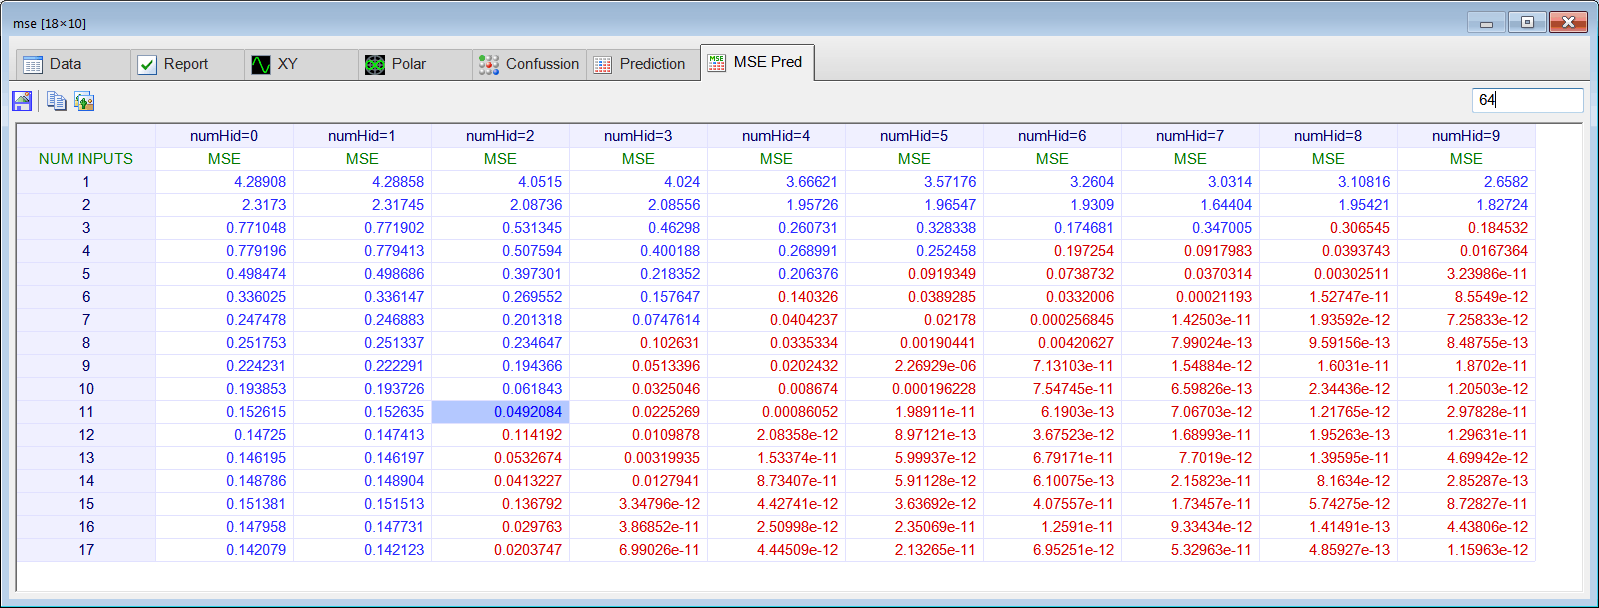
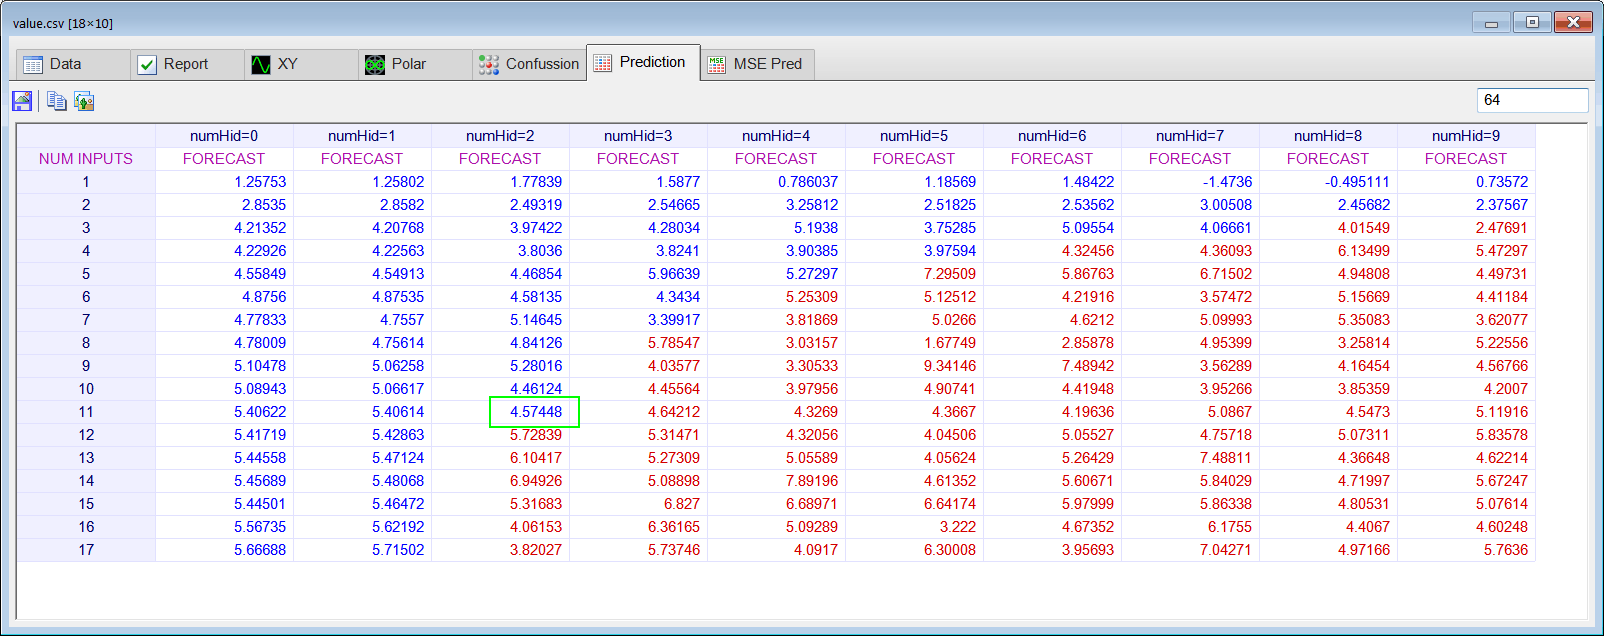
| Problem 5 |
| Perform STEP 4. Combine the line prediction with the ANN prediction to estimate y[64]. |
| Series Length | Actual Value | yline[64] | yann[64] | Estimate of y[64] |
| 64 | y[64]=23.75 |
| Problem 6 |
| Remove the last value from yann.csv and save the series with the name yann63.csv. Perform the prediction analysis to compute the mse prediction analysis table and the value prediction analysis table. Using the results of the prediction analysis, predict the value of y[63]. You may write a program to use your computer to programmatically perform the prediction validation of problems 6, 7 and 8, remember that you can use the Prediction function of a mse matrix. |
| Series Length | Actual Value | yline[63] | yann[63] | Estimate of y[63] |
| 63 | y[63]=21.46 |
| Problem 7 |
| Remove another value at the end from yann.csv) and save the series with the name yann62.csv. Perform the prediction analysis to compute the mse prediction analysis table and the value prediction analysis table. Using the results of the prediction analysis, predict the value of y[62]. |
| Series Length | Actual Value | yline[62] | yann[62] | Estimate of y[62] |
| 62 | y[62]= 18.42 |
| Problem 8 |
| (a) Keep removing values at the end of the series and complete the table below with the predicted value using for each case using an ANN. (b) Compute the mse between the actual and the predicted values using the 10 values in the table. |
| Series Length | Actual Value | yline | yann | Estimate of y |
| 63 | y[63]=21.46 | |||
| 62 | y[62]=18.52 | |||
| 61 | y[61]=18.17 | |||
| 60 | y[60]=19.46 | |||
| 59 | y[59]=20.27 | |||
| 58 | y[58]=18.40 | |||
| 57 | y[57]=15.14 | |||
| 56 | y[56]=11.91 | |||
| 55 | y[55]=11.91 | |||
| 54 | y[54]=13.64 |